OpenAI Images 2.6 Real Cost: Same Rate Card, 4.2x the Tokens at Low Quality
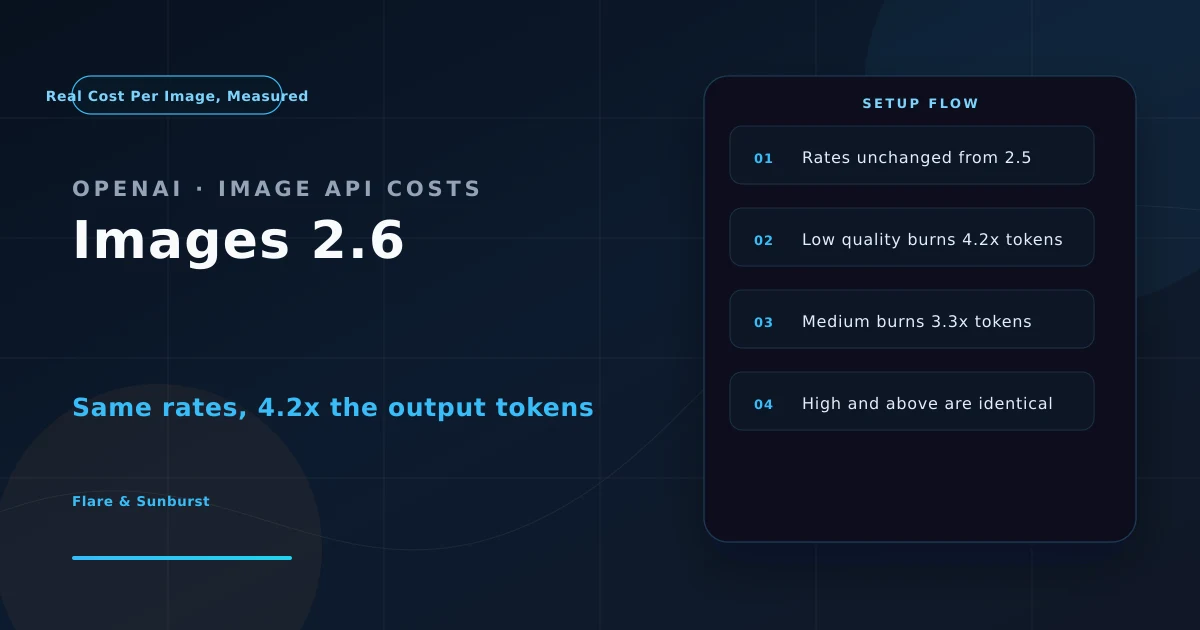
GPT-Image-2.6 Flare and Sunburst have identical token rates to 2.5, yet low-quality output tokens increased 4.2x and medium 3.3x. This guide reconstructs the measured per-image cost at every quality tier from 80-run benchmark data, and gives a clear rule for staying on 2.5 vs migrating to 2.6.
Introduction: The Most Expensive Misunderstanding in Token Pricing
On 2026-11-04, OpenAI released GPT-Image-2.6 with two models:
| Model | Positioning |
|---|---|
gpt-image-2.6-flare | Speed first — fast iteration, interactive generation and editing |
gpt-image-2.6-sunburst | Detail first — dense compositions, text-heavy layouts, cross-edit consistency |
The headline features are compelling: roughly 50% faster generation, GIF output, SVG, markup-guided edits, and a complexity parameter.
So most coverage concluded the price hadn’t changed. And on the rate card, that’s exactly right:
| Token type | Images 2.6 | Images 2.5 |
|---|---|---|
| Text input | $5.00 | $5.00 |
| Cached text input | $1.25 | $1.25 |
| Image input | $8.00 | $8.00 |
| Cached image input | $2.00 | $2.00 |
| Image output | $30.00 | $30.00 |
That conclusion is wrong.
The reality: for the same prompt, the same size, and the same quality tier, 2.6 can burn dramatically more output tokens. The rate card didn’t move — but the number of images you get per dollar did. And image APIs bill on output tokens.
This article reconstructs the true per-image cost from third-party measurements (CellCog’s 80-run benchmark, plus independent tests from AI/ML API and eesel), and gives you a concrete rule for choosing between 2.5 and 2.6.
1. The Core Finding: The Rate Card Held, the Token Count Didn’t
1.1 Measured Output Tokens (1024×1024, Same Prompt)
| Quality | Images 2.5 tokens | Images 2.6 tokens | Multiple | 2.5 cost | 2.6 cost |
|---|---|---|---|---|---|
| low | 196 | 824 | 4.2× | $0.006 | $0.025 |
| medium | 439 | 1,449 | 3.3× | $0.013 | $0.044 |
| high | 1,758 | 1,758 | 1× | $0.053 | $0.053 |
| xhigh | 3,122 | 3,122 | 1× | ~$0.094 | ~$0.094 |
| max | 7,024 | 7,024 | 1× | ~$0.211 | ~$0.211 |
(Source: CellCog’s 80-run matched test; costs derived from $30/1M output tokens)
The pattern is unusually clean:
- The cheaper the tier, the more it grew — low up 4.2×, medium up 3.3×;
- The pricier tiers are byte-identical — high, xhigh, and max consume exactly the same tokens on both versions.
1.2 OpenAI’s Own Cost Calculator Confirms It
eesel’s analysis of OpenAI’s official cost calculator found its code multiplies 2.6 token counts by:
- 4.2 at the low tier,
- 3.3 at the medium tier,
- 1 (unchanged) at high, xhigh, and max.
So this isn’t measurement noise — it’s OpenAI’s own model-page logic. 2.6 “thinks harder” in the cheap tiers, where low-quality output previously let the model take a shortcut. The cost of that shows up in tokens.
1.3 Why This Is So Easy to Miss
Three things have to be true simultaneously:
- The rate card is identical — anyone comparing pricing pages concludes “no change”;
- High and medium-high tiers are identical — if you only test at high quality, you’ll wrongly conclude “no cost change”;
- Launch coverage focused on features (GIF, SVG, markup editing, complexity) and rarely measured token counts in the low tier.
And bulk asset production lives in exactly the low tier — icons, thumbnails, placeholders, tiles, variation drafts. That’s the workflow most affected.
2. Real Cost: From “Per Image” to “Per Generation Attempt”
2.1 How Image APIs Actually Bill
OpenAI does not publish a flat per-image price. Image output is billed by token:
Cost per image = output tokens / 1,000,000 × $30
And output tokens depend on three variables:
| Variable | Effect |
|---|---|
| quality | The biggest lever — low to max spans 36× in token count |
| size | 1024×1024 / 1024×1536 / 1536×1024 etc. — bigger area, more tokens |
| model | 2.5 vs 2.6 differ 3–4× at low/medium; identical at high and above |
Key: you must read the usage field on the response. Any claim of a “fixed $0.0X per image” is a guess.
2.2 Measured Costs Across Tiers
From AI/ML API’s independent test (1024×1024):
| Quality | Images 2.5 | Images 2.6 | Delta |
|---|---|---|---|
| low | $0.006 | $0.025 | +317% |
| medium | $0.013 | $0.044 | +238% |
| high | $0.053 | $0.053 | 0% |
Community estimates (1024×1024):
| Size | low | medium | high |
|---|---|---|---|
| 1024×1024 | $0.006 | $0.053 | $0.211 |
| 1024×1536 | $0.005 | $0.041 | $0.165 |
| 1536×1024 | $0.005 | $0.041 | $0.165 |
These numbers come from different third-party tests and don’t fully agree — that’s why the source brief flagged them as community estimates. The disagreement comes from different prompt complexity, output compression settings, and
complexityparameter values. The only reliable conclusion is the relative relationship: 2.6 is clearly more expensive at low/medium, and on par with 2.5 at high and above.
2.3 The GIF Cost Model
GIF is 2.6’s marquee feature, and its cost has a misconception trap:
A GIF costs the same as a single image of the combined area of all its frames.
Measured (AI/ML API):
| GIF configuration | Cost |
|---|---|
| 12 frames 512×512 (medium) | $0.055 |
| 12 frames 512×512 (high) | $0.067 |
| 16 frames 720×720 (max size, high) | $0.147 |
Note that a 12-frame 512×512 GIF ($0.055) costs more than one 1024×1024 static image ($0.044). If you’re generating animations in bulk, recalculate expectations by frame count — don’t reuse static-image intuition.
2.4 The Batch Discount Gap
Worth calling out on its own:
- Images 2.5: image output Batch rate $15/1M (half the standard rate);
- Images 2.6: Batch rate not listed.
If your pipeline is offline batch generation (icon sets, asset libraries, variation sweeps), 2.5’s Batch discount stacks with the 4.2× token gap and widens the advantage further.
Community testing also notes: 2.6’s low-quality tier reportedly has no Batch discount, making bulk low-quality assets 4.2× more expensive with nothing to offset it.
3. Flare vs Sunburst: Same Price, Pick by the Job
Both models share identical pricing (same rate card), so selection comes down to two things: speed and consistency.
| Dimension | gpt-image-2.6-flare | gpt-image-2.6-sunburst |
|---|---|---|
| Positioning | Speed first | Detail first |
| Speed | As little as 6 seconds per image at low quality | Slower; OpenAI publishes no figure |
| Layout quality | Improved layouts for posters, product imagery | Dense compositions, text-heavy layouts |
| Cross-edit consistency | Average | Stronger at medium/high (same character or product across 5 edits without drift) |
| Price | Same rate card | Same rate card |
Third-party leaderboard (Arena):
| Arena category | GPT Image 2.6 Sunburst | Nano Banana 2.1 |
|---|---|---|
| Text-to-image | 1409 | 1325 |
| Single-image edit | 1476 | 1427 |
The decision rule is simple:
- You’re still exploring direction (need 10 layout variants) → Flare, because speed is money;
- You’re producing the final deliverable (same character, five successive edits) → Sunburst, because consistency is everything;
- Don’t run everything through Sunburst just because it’s “higher quality” — at the low tier it gives you no quality benefit, only a speed penalty.
4. Decision Framework: When to Stay on 2.5
The most useful section of the article.
4.1 Selection Table
| Your scenario | Recommendation | Why |
|---|---|---|
| Bulk low-quality assets (icons, thumbnails, tiles, placeholders) | Stay on 2.5 | 2.6 is 4.2× pricier with (reportedly) no Batch discount |
| Medium-quality product shots | A/B test 2.5 vs 2.6 | 3.3× gap may be worth paying for quality |
| High-quality deliverables | 2.6 (Flare or Sunburst) | Identical cost, ~50% faster |
| GIF / SVG animation | 2.6 only | 2.5 can’t do it at all |
| High cross-edit consistency (same character/product) | 2.6 Sunburst | Consistency is the headline feature |
| Need a reproducible frozen snapshot | Watch this risk | 2.6 has no dated model string (see below) |
4.2 Three Checks Before You Migrate
① 2.6 has no dated model ID
Community testing points out: 2.6 does not offer a gpt-image-2.6-2026-xx-xx-style pinnable string.
If you need reproducible production snapshots, this is a genuine risk — if upstream changes behavior, you have no way to roll back to a known state. Mitigation: build your own output cache + version tagging in the application layer.
② 2.6 Sunburst may be slower than 2.5 Sunburst
Testing feedback reports 2.6 Sunburst being slower than 2.5 Sunburst at equivalent quality, despite the headline “50% faster” (the speedup is mostly Flare, and the high/medium tiers). If your pipeline has a latency SLA, measure it.
③ No dated string means no frozen snapshot
Same as ①, but worth its own bullet because it affects regression testing: your prompt’s output on 2.6 will drift as upstream updates, and you have no rollback point.
4.3 The One-Week Measurement Method
Don’t trust anyone’s estimate — including this article’s. Run your own for a week:
import openai, time, statistics

PROMPTS = [
    # three real prompts from your own workload, one per complexity level
]

def measure(client, model, prompt, quality, size="1024x1024"):
    t0 = time.time()
    resp = client.images.generate(
        model=model, prompt=prompt, quality=quality, size=size
    )
    elapsed = time.time() - t0
    usage = resp.usage
    out_tokens = getattr(usage, "output_tokens", None) or usage.get("output_tokens")
    cost = out_tokens / 1_000_000 * 30.0
    return {"model": model, "quality": quality, "out_tokens": out_tokens,
            "cost": cost, "seconds": elapsed}

results = []
for prompt in PROMPTS:
    for q in ("low", "medium", "high"):
        for m in ("gpt-image-2.5-flare", "gpt-image-2.6-flare"):
            results.append(measure(client, m, prompt, q))

# aggregate by (quality, model) and compare medians, not means
Three disciplines:
- Read
usage, don’t compute it — OpenAI publishes no fixed per-image price, so the response is the only source; - Compare medians, not means — one outlier generation can skew a mean by 3×;
- Factor in acceptance rate — real cost = per-attempt cost ÷ success rate. This is the same logic as the GPT-6.1 Terra selection guide: a low unit cost is not a low task cost.
5. Where Competitors Sit
Independent tests from early November 2026:
| Comparison | GPT Image 2.6 | Nano Banana 2.1 (Google) | Gemini Omni 1.2 Flash |
|---|---|---|---|
| Input / 1M | $5 | $1.50 | — |
| Image output / 1M | $30 | $30 | — |
| Our poster (1024×1024, medium) | $0.044, 26 s | $0.047, 28 s | — |
| At high quality | slightly more | — | — |
| At low quality | about half | — | — |
| GIF output | — | ||
| Web search while generating | (off by default) | — |
An interesting result: 2.6 at low quality is roughly half the price of Google’s Nano Banana 2.1 — even though both are far above their respective 2.5-generation baselines. So “expensive” needs a qualifier: 2.6’s low tier is expensive relative to 2.5, not relative to competitors.
6. The NixAPI Angle: A Unified Billing View
This is exactly where an aggregator earns its keep on image APIs.
Looking at a single vendor, “the rate is unchanged” convinces you that nothing changed. But true cost depends on three variables (model × quality × size) plus the vendor’s token-generation strategy — and none of that is visible on a single billing page.
Where the NixAPI unified endpoint helps:
- Bill on usage, not on “per image” — actual token counts from
usageflow straight into your cost view; - Cross-vendor comparability — Nano Banana 2.1’s $0.047 and GPT Image 2.6’s $0.044 are only directly comparable inside one billing view;
- Routing rules can key on real cost — e.g. “route low-quality bulk assets to 2.5, route high-quality deliverables to 2.6 Sunburst”;
- Batch-discount status is visible — the fact that 2.5 has a Batch rate and 2.6 doesn’t is exactly the kind of difference you need to spot at a glance.
Live model list and current pricing: NixAPI pricing.
7. Conclusion
Images 2.6 demonstrates something worth internalizing: on token-priced APIs, “the rate card didn’t change” and “the cost didn’t change” are two different statements.
What sits between them is upstream token-generation strategy — and you cannot infer that from a pricing page. You can only measure it.
Four takeaways for developers:
- Establish a baseline from the
usagefield — run your own workload before migrating; don’t rely on community estimates; - Stay on 2.5 for low/medium quality, use 2.6 for high quality — this is the clearest conclusion the current data supports;
- 2.6 has no pinnable model string — production systems needing reproducibility must implement their own output caching;
- Recalculate GIF costs by frame count — a 12-frame 512×512 GIF costs more than one 1024×1024 still.
One practical note to close: if you’re about to “upgrade to 2.6 because it’s 50% faster,” first confirm which quality tier carries your production volume. If it’s low or medium, faster but more expensive can be a bad trade. If it’s high or above, the speedup is free.
Further reading:
- OpenAI official: GPT-Image-2.6 Flare model page
- OpenAI official: GPT-Image-2.6 Sunburst model page
- OpenAI official: Images API guide
- OpenAI official: Pricing
- Related reading: GPT-6.1 Terra API Pricing & Selection Guide
This article was written by the NixAPI editorial team. NixAPI is a unified aggregator for multiple LLM APIs, supporting 30+ models including OpenAI / Anthropic / Google / DeepSeek. Console registration includes a $1 trial credit.